The 100 metres remains a deceptively simple event: a straight-line dash from start to finish. But performance specialists say the race is best understood as a sequence of distinct biomechanical and physiological phases. In a review of sprint data and coaching insight, two experienced practitioners framed the event as a problem of managing speed over time, not merely achieving the highest instantaneous velocity.
Phases of the race
Former world medallist and performance director Craig Pickering described the 100m as “akin to a maths problem which needs the perfect equation to solve it”, arguing the winner is the athlete who achieves the highest average velocity over the full distance. Edrick Floreal, coach of Olympic champion Julien Alfred, prefers a jigsaw analogy: the race blends elements of shorter and longer sprints and requires multiple attributes to align.
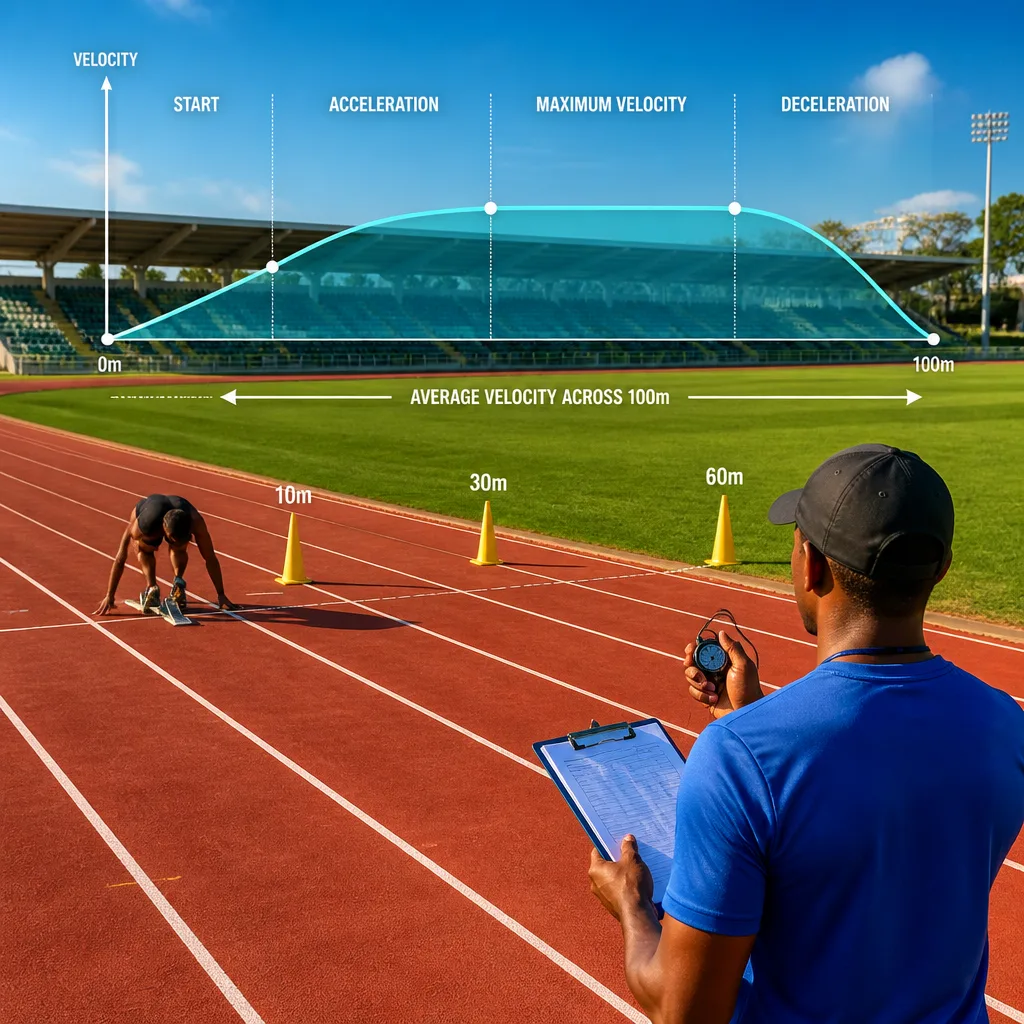
- Start (blocks): Reaction time and initial force production. Elite reaction times are typically between 0.120s and 0.150s.
- Acceleration: Transition from low speed into top speed, lasting variably between athletes and sometimes extending to 45–65m.
- Maximum velocity: The phase when stride length and frequency combine to yield peak speed.
- Deceleration/maintenance: The final section where athletes resist slowing; winners often manage a smaller decline in speed than rivals.
What matters most
Pickering emphasised that a superior top speed alone does not guarantee victory: “The person who wins has the highest average velocity,” he said. That average depends on how quickly an athlete accelerates, how long they sustain near-maximum speed and how well they limit deceleration.
“Imagine going from no speed at all and into the fastest speed in the shortest time possible. Unlike the rest of the 100m, at this point the more time on the ground is good as you need to generate that power.”
The quote refers to the start phase, where, contrary to the rest of the race, a longer ground contact time helps generate force. This is a technical nuance: in later phases athletes aim to minimise ground contact to increase turnover, but the blocks demand force applied into the track.
Benchmarks and variability
Pickering offered concrete split benchmarks for elite male sprinters that provide a useful reference for coaches and performance analysts. Typical target splits cited were:
| Distance | Typical elite split |
|---|---|
| 10m | ~1.9s |
| 30m | ~3.7s |
| 60m | ~6.40–6.50s |
These are not rigid standards for all athletes. Pickering noted variation in how far acceleration extends; some sprinters may accelerate up to 65m, while others reach peak speed earlier. The common aim among sub-10-second contenders is to compress time across these early splits so the average velocity over 100m is maximised.
Training and practical implications
Understanding the race as phase-dependent has direct implications for coaching and programme design. For example:
- Block work and strength training target the start and initial force production.
- Short to mid-distance sprint repetitions develop the acceleration profile and ability to reach high velocity quickly.
- Speed endurance and technique sessions help athletes sustain near-maximum speed and resist deceleration in the closing metres.
Floreal’s jigsaw metaphor underlines the need for a multifaceted approach: power, technique, stride mechanics and energy management all interact. For practitioners and athletes alike, the takeaway is that small gains in different phases can combine to yield a meaningful improvement in average velocity.
For South African coaches and athletes, these insights reinforce established practice while emphasising measurement. Timed splits, video analysis and force/velocity profiling can reveal which phase limits an individual athlete and inform targeted interventions.
In short, winning the 100m is less about a single moment of brilliance and more about assembling many smaller advantages across the race — the fractal of speed that, when added together, delivers the fastest average over 100 metres.