India's southwest monsoon has so far been uneven, delivering an overall shortfall but highly variable rainfall across the states, the India Meteorological Department (IMD) reported for the period June 4 to August 10. Nationally, cumulative precipitation stood at 465.9 mm against a normal of 527.2 mm, leaving the country with a 12% deficit.
Sharp contrasts: which states are dry and which are wet
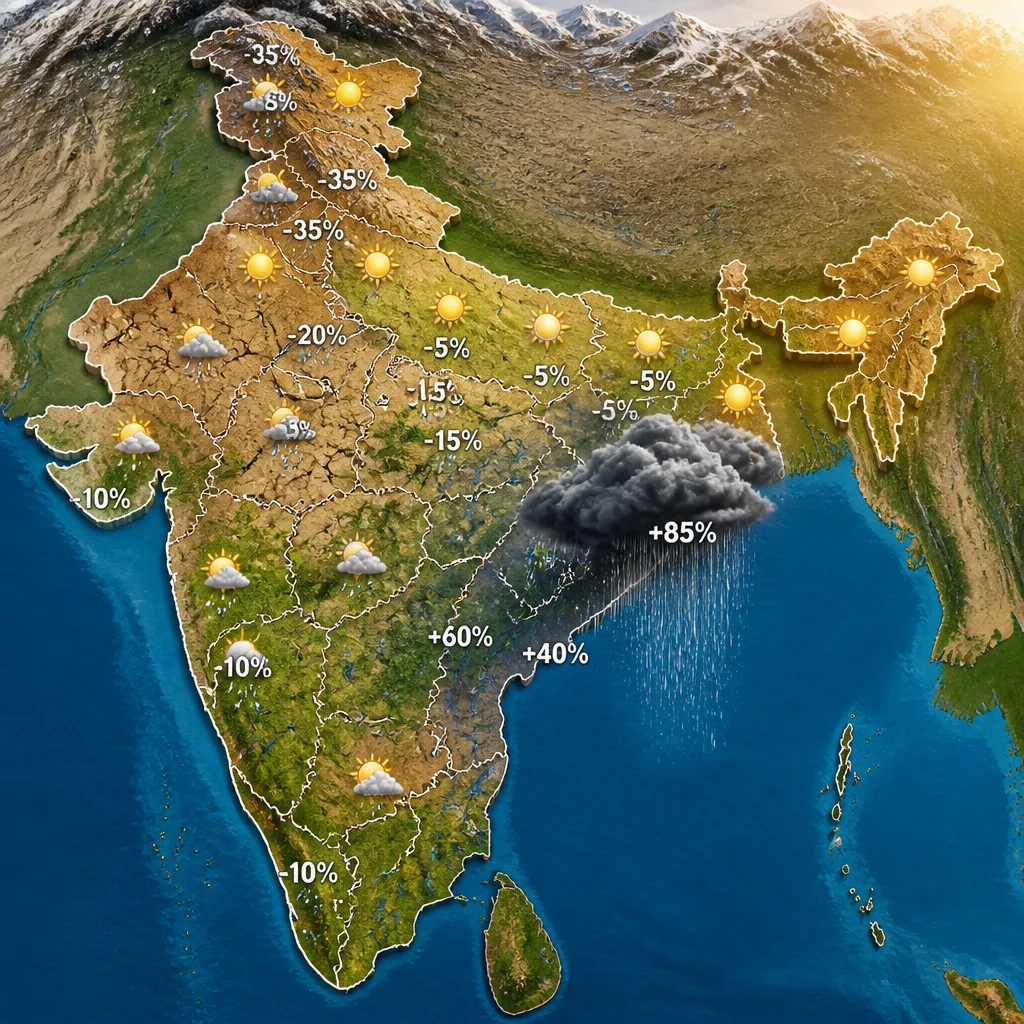
The aggregate 12% deficit masks large regional differences. The northeastern hill state of Meghalaya — typically India's wettest — is currently the driest in percentage terms, recording 763.1 mm against a long-period normal of 1,739.6 mm, a shortfall of about 56%. Several other states have significant deficits: Arunachal Pradesh and Manipur are down by roughly 36%, while Bihar is also about 36% below normal. In the north and south, Punjab and Andhra Pradesh each show deficits near 35%, and Goa is about 35% short.
By contrast, Odisha has so far experienced the largest positive anomaly. The state received 857.8 mm compared with a normal of 668.7 mm, representing an excess of 28%. IMD data attribute Odisha's surplus to repeated low-pressure systems and associated moisture surges.
On August 8, IMD noted formation of a low-pressure area over south Gangetic West Bengal and adjoining north Odisha under an upper-air cyclonic circulation, which brought repeated heavy rain to Odisha.
Such systems can concentrate intense rainfall in limited areas while leaving neighbouring regions relatively dry, explaining much of the spatial variability observed so far.
What the pattern means and why it happens
The monsoon is not uniformly distributed across time or space. The IMD emphasises that activity waxes and wanes as the monsoon trough shifts, and as low-pressure systems form and move. These features interact with local topography and coastal geometry to produce bursts of heavy rain or extended dry spells.
From a practical perspective, the unevenness has implications for agriculture, reservoir management and flood risk. Regions seeing deficits may face stress for sowing, crop growth and water storage, while areas with excess rainfall — especially when associated with slow-moving low-pressure systems — are at higher risk of flooding and landslides.
- National cumulative rainfall: 465.9 mm vs normal 527.2 mm (-12%).
- Largest deficit (percentage): Meghalaya, -56% (763.1 mm vs 1,739.6 mm).
- Largest surplus (percentage): Odisha, +28% (857.8 mm vs 668.7 mm).
| State | Observed (mm) | Normal (mm) | Deviation |
|---|---|---|---|
| Meghalaya | 763.1 | 1,739.6 | -56% |
| Odisha | 857.8 | 668.7 | +28% |
| Bihar | — | — | -36% |
Note: where the IMD released state-level totals and normals these are shown; percentage deviations for some states were provided directly by IMD.
Monsoon forecasting involves probabilistic assessment of the large-scale circulation, seasonal tendency and synoptic systems. Anomalies at the state level can therefore differ substantially from the national average, and short-term developments — such as the August 8 low-pressure area — can alter local conditions quickly.
For stakeholders, the IMD figures serve as an early-season diagnostic. Farmers, water managers and disaster-response agencies will monitor subsequent IMD advisories and updated rainfall analyses to adapt sowing decisions, reservoir releases and flood preparedness. Continued monitoring of low-pressure developments and the shifting monsoon trough will be crucial to anticipate whether the current deficits narrow or widen in the coming weeks.
The IMD dataset cited here covers the period up to August 10; readers should consult the IMD for the latest bulletins and district-level rainfall maps as the season progresses.