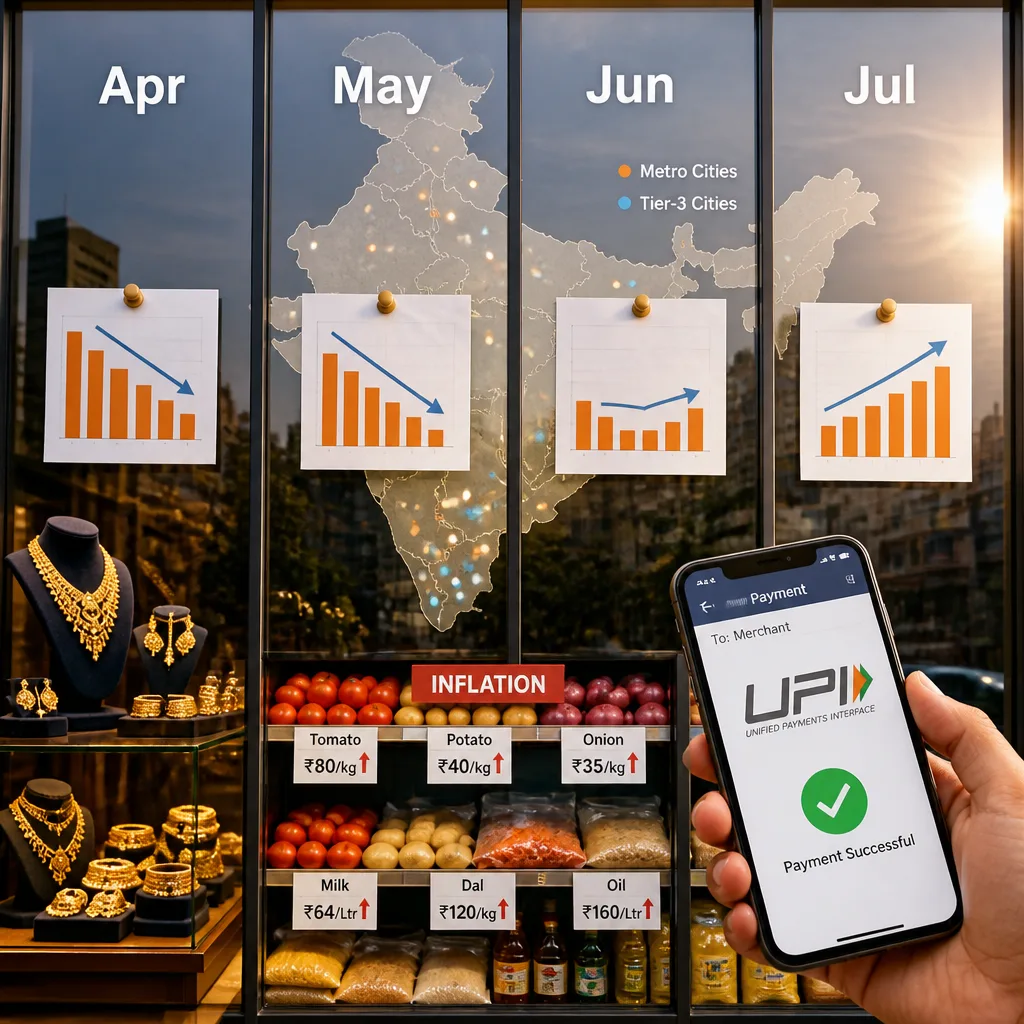
The RAI‑Innoviti SANKET report, produced by the Retailers Association of India in partnership with payment‑technology firm Innoviti, showed that same‑store retail growth across India softened through April, May and June — falling from 9.4% in April to 7.8% in May and 4.7% in June — before partially recovering to 6.8% in July, the latest edition reported.
What the numbers mean
Because the SANKET series measures like‑for‑like sales (current month sales compared with the same month a year earlier at the same stores), the data strips out the effect of new store openings and gives a cleaner view of consumer demand. The quarter’s pattern — an early slowdown followed by a July rebound — points to a soft Q1 that showed signs of recovery by the start of Q2.
Key category and geographic shifts accounted for the volatility. Jewellery led the swings, reflecting festival and wedding season timing: it surged to +14.2% in April around Akshaya Tritiya, eased to +4.6% in May and then settled in the mid‑single digits at +6.6% in June and +6.4% in July. Grocery was relatively steady around ~7% for two months, dipped to 4.3% in June when food inflation hit a 16‑month high, and rebounded to 7.5% in July as monsoon rains helped ease supply constraints.
Consumer electronics and fashion maintained positive growth throughout the period and improved into July, the report said. Regionally, the South was the most resilient across the four months. The West showed the largest swing: the sharpest deceleration in Q1 but also the strongest rebound in July. Smaller cities outpaced metros through the quarter, with the Tier‑3 lead over Tier‑1 widening from 0.7 percentage points in April to 2.4 points in June before narrowing to 1.9 points in July as metros recovered faster.
Payments trends and what they indicate
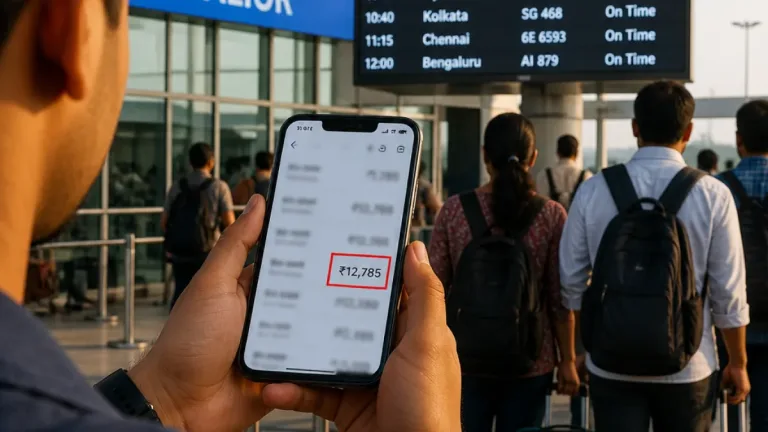
Payments patterns in the SANKET report underline a structural shift toward UPI. UPI transaction growth outpaced card growth consistently: UPI rose 22% in April versus 4.6% for cards, slowed to 12% versus 0.7% by June, then re‑accelerated in July to 14% for UPI and 3.2% for cards. This persistence suggests UPI is continuing to take share of retail payment flows even as the retail cycle softens and recovers.
- Like‑for‑like growth: 9.4% (Apr) → 7.8% (May) → 4.7% (Jun) → 6.8% (Jul).
- Category volatility: Jewellery most volatile; grocery hit by food inflation in June then rebounded in July.
- Geography: South held up best; Tier‑3 cities led through Q1 but metros rebounded in July.
| Month | Like‑for‑like growth |
|---|---|
| April | 9.4% |
| May | 7.8% |
| June | 4.7% |
| July | 6.8% |
For consumers and businesses the takeaways are practical. Retailers should watch category seasonality and regional demand cycles closely: jewellery and grocery showed opposite drivers (festive/wedding timing versus food inflation and supply). Payment acceptance strategies matter: merchants that optimise for UPI stand to capture a greater share of everyday transactions as consumers increasingly choose low‑cost digital options.
For policy makers and analysts, the SANKET pattern suggests that Q1 weakness was not uniform across the country or categories. The narrowing gap between small cities and metros in July implies some of the early quarter weakness in metros may have been event‑driven rather than structural, according to the report.
Investors and corporates should note that like‑for‑like metrics provide a different picture from headline retail sales that include store expansion. Companies relying on top‑line expansion through new openings may therefore see divergent signals compared with firms focused on same‑store performance.
The RAI‑Innoviti SANKET report uses same‑store transaction data to provide a month‑by‑month barometer of demand across categories and cities. Its latest edition highlights the uneven, category‑ and geography‑driven nature of the retail slowdown in Q1 and the partial recovery in July, with payments data reaffirming UPI’s continued momentum.