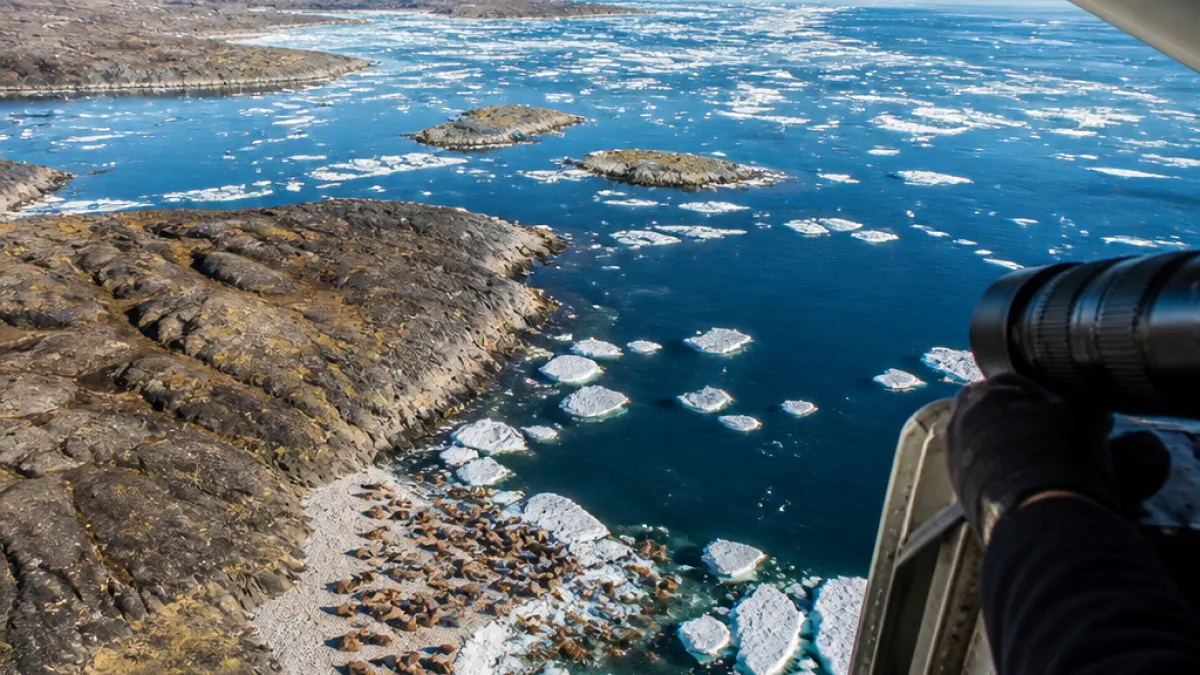
Last summer, government researchers and their partners collected 292,000 photographs of Nunavut’s coastline in a single, wide-ranging aerial survey — a scale of imagery that underlines growing interest in walrus populations and the pressures that shape life on the territory’s shores.
Why so many photos?
The reason for the mass collection was the subject of a recent northern news quiz, which presented three possible aims: counting two distinct walrus stocks at once (and accounting for migration between them); tracking a skin disease reported by hunters; or — more prosaically — compiling a calendar of walrus images. The quiz did not single out a single answer but it highlighted the range of motivations that can prompt such an extensive photographic effort.
Aerial images are increasingly a core tool for Arctic wildlife research. They allow researchers to estimate numbers of animals hauled out on ice or shore, to monitor distribution patterns at key times of year, and to watch for signs of disease or unusual mortalities. For Nunavummiut, who rely on marine mammals for food and cultural practice, those scientific pictures matter for both harvest planning and conservation conversations.
Local stakes: hunters, culture and food security
Walrus are a shared resource whose management ties into Inuit knowledge and subsistence needs. Hunters across Nunavut take part in seasonal walrus hunts that supply fresh meat and rawhide for clothing and tools. Information about where walrus are found, how many there are, and whether animals appear healthy informs local and territorial decisions about harvest timing and safety.
For communities that depend on country food, improved population estimates can help avoid overharvesting in areas where numbers have declined, while also identifying opportunities to support sustainable harvest where populations are stable or increasing. Photographic surveys, when paired with local observations, can strengthen those discussions.
What the imagery can reveal
- Population counts and distribution: high-resolution aerial images let researchers tally individuals hauled out on ice floes or beaches.
- Movement patterns: repeated surveys over time can show seasonal shifts and potential migration between stock areas.
- Health signals: visible skin lesions, unusual mortalities, or animals in poor condition can be flagged for follow-up.
These uses align with several of the reasons offered in the quiz format. The photos can serve multiple purposes simultaneously: counting animals while also screening for disease indicators or creating a visual record for outreach and education.
How imagery gets used — and by whom
Photographic data from aerial surveys are typically analysed by federal and territorial biologists, often in collaboration with Inuit organisations and local hunters. The imagery can be reviewed manually or with the help of image-processing software to detect and count animals. Results may feed into management advice from fisheries and wildlife agencies, and into community briefings where hunters and elders share their observations and concerns.
In Nunavut, those conversations are especially important because local harvesting rights and practices are grounded in long-standing Inuit knowledge. When science and local knowledge are brought together, communities are better positioned to make informed choices about when, where and how to harvest.
What comes next
Large datasets such as 292,000 photographs require time and resources to analyse. The next steps typically include quality control, georeferencing images to place sightings on the map, and integrating photographic findings with on-the-ground reports. Findings that point to changes in abundance or health would usually prompt additional field work or community consultations.
For residents of Nunavut, the outcome most of interest will be clear, usable information: Are walrus numbers holding steady? Are animals moving into new areas? Are there signs of disease or mass mortality that require action? Those answers will shape both local harvest planning and territorial policy.
| Photographic effort | Possible uses |
|---|---|
| 292,000 images | Population estimates, migration tracking, health screening, outreach |
As analysis proceeds, researchers and communities will need to prioritise transparency and the sharing of results in accessible ways. For hunters and community members who live with walrus on the land and sea, timely communication is key to ensuring that scientific work supports — rather than supplants — Inuit-led stewardship.
Collecting nearly 300,000 coastal photos was a major logistical undertaking. Whether the images end up primarily answering questions about stock boundaries, disease, or simply creating a handsome calendar, their value will be assessed by how well they help Nunavummiut care for a species central to northern life.