Richmond leads, Tower Hamlets trails: Ofqual data lays bare borough divides
The latest figures from Ofqual reveal a striking contrast in A‑level outcomes across London, with Richmond upon Thames recording the highest proportion of top grades and Tower Hamlets the lowest.
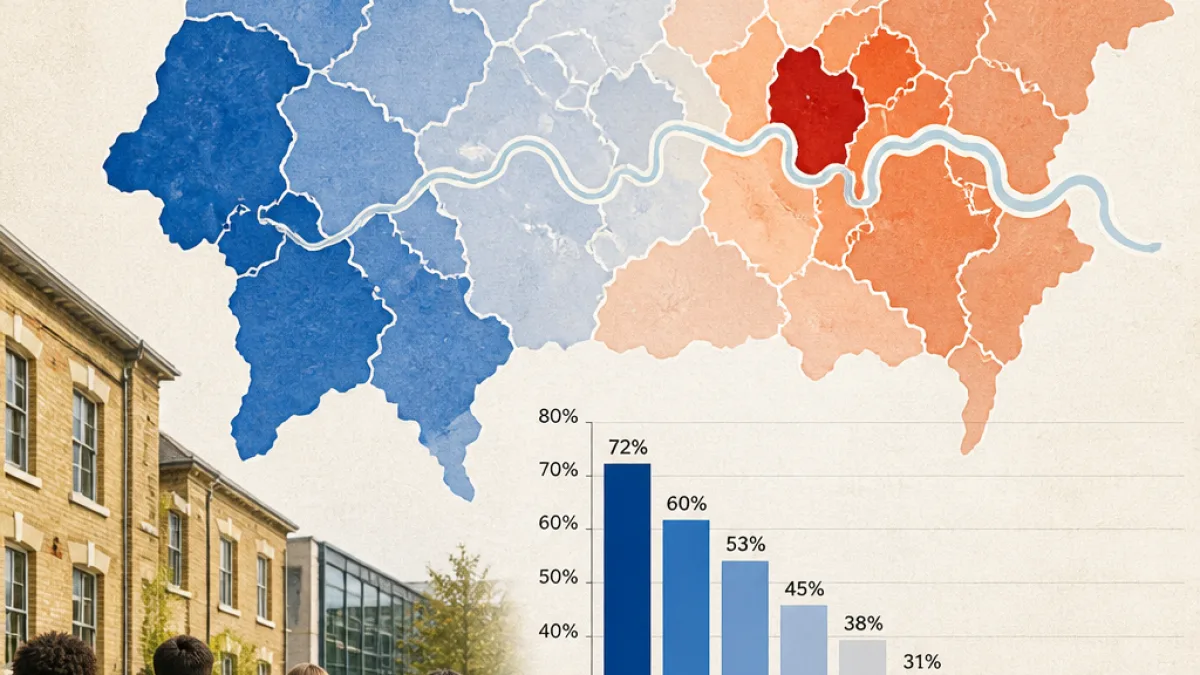
According to the published data, 48.7% of A‑level entries in Richmond were awarded an A or A* this year. That compares with just 17.1% in Tower Hamlets — a gap of 31.6 percentage points between the top and bottom boroughs in the capital.
“nearly three times”
The list of London’s top-performing boroughs by share of A/A* grades is led by Richmond, followed by Kingston (45.3%), Sutton (44.5%), Southwark (43.8%) and Newham (43.2%). At the other end of the scale, besides Tower Hamlets, Havering posted 17.5%, while both Islington and Barking & Dagenham recorded 19.1%.
Some boroughs made notable movements year on year. Merton recorded the biggest improvement in London, with its share of A/A* grades rising by 3.6 percentage points, from 37.1% to 40.7%, pushing it into the capital’s top nine. Haringey also achieved a substantial rise of 3.3 percentage points, moving from 39.8% to 43.1%, and now sits sixth in London. By contrast, Camden experienced the largest fall among London boroughs, slipping from 32.1% to 30.5%.
Wider regional picture and national context
While London performs strongly overall, the Ofqual release shows disparities both within the capital and between regions. Outside London, Guildford in Surrey topped England’s local authorities with 50.0% of entries awarded A or A*, up from 48.8% in 2025. Among the highest performing local authorities nationally, only one of the top 10 sits outside southern England: Trafford in Greater Manchester, joint seventh with 45.1%.
At the national low end, Harlow had the smallest share of top A‑level entries at 7.0%, followed by Test Valley (9.9%), Hartlepool (10.5%) and Castle Point (11.8%). The gap between London’s share of A/A* grades and that of the North East and the East Midlands has widened to its largest level on record, with London outscoring those regions by 9.6 percentage points. The South East remains the closest competitor to London, with 31.5% of entries awarded A*/A.
| Top five London boroughs | A/A* share |
|---|---|
| Richmond upon Thames | 48.7% |
| Kingston | 45.3% |
| Sutton | 44.5% |
| Southwark | 43.8% |
| Newham | 43.2% |
And the boroughs with the lowest shares:
- Tower Hamlets — 17.1%
- Havering — 17.5%
- Islington — 19.1%
- Barking & Dagenham — 19.1%
Implications for pupils, schools and local services
The figures underline long‑running inequalities in educational outcomes across London. A large gap between neighbouring boroughs points to differences in local provision, socio‑economic factors, and access to resources such as high‑performing sixth forms and tutoring. Boroughs showing year‑on‑year improvements, such as Merton and Haringey, will be seeking to consolidate those gains. Where shares of top grades have fallen, school leaders and local authorities will face pressure to explain causes and set out recovery plans.
For students, the distribution of A/A* grades affects university offers and pathways into competitive courses and careers. For local councils and the Greater London Authority, the data will be a prompt to review school improvement strategies, funding priorities and targeted support for areas that lag behind.
Ofqual’s publication provides a borough‑level snapshot but does not explain causal factors. Stakeholders across the capital will now be looking for detailed analysis from schools, councils and the Department for Education to understand which interventions are working and where more focus is required.
These A‑level results will form part of a wider conversation about fairness in education across London in the months ahead.