
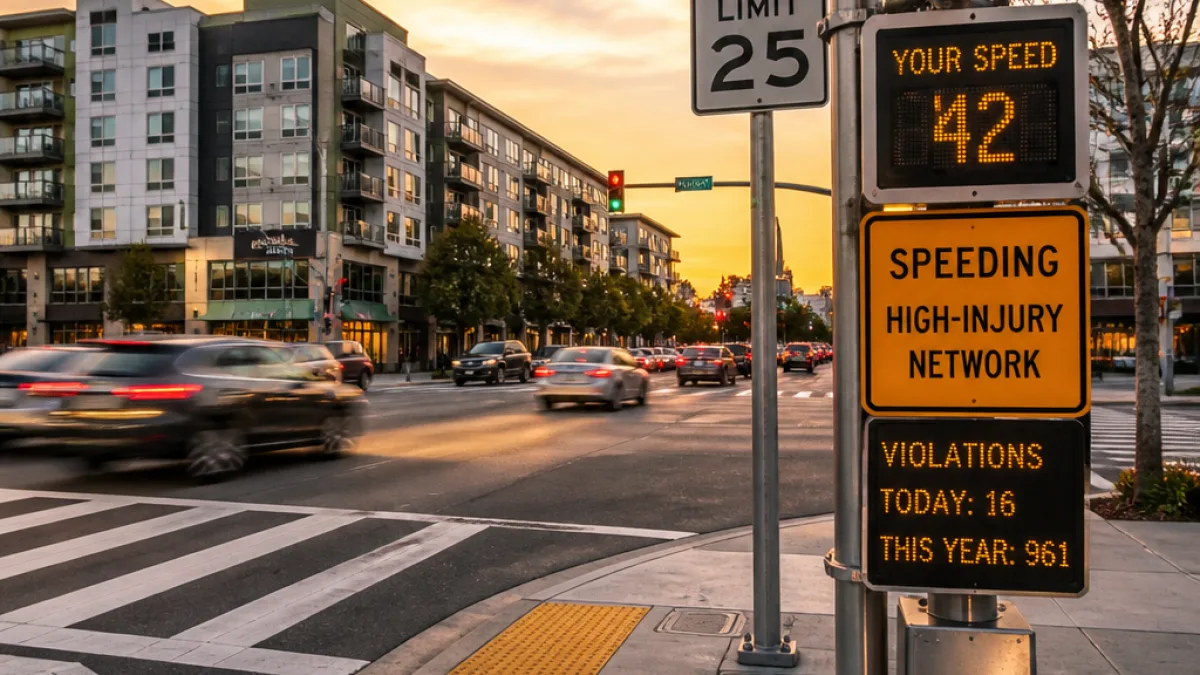
Oakland’s speed safety camera pilot, launched this January, has produced substantial changes in driving behavior along the city’s most dangerous corridors, according to a newly released city report. The program placed 35 cameras at 18 intersections on Oakland’s High-Injury Network — the roughly 6% of city streets that account for 60% of severe and fatal collisions — and has already issued more than half a million recorded violations.
Scale and early results
The report shows the cameras recorded a total of 526,324 violations during the period covered. Of those, 193,508 resulted in citations and 332,816 were warnings. City officials noted most warnings occurred during the initial 60-day warning period while drivers adjusted to the new enforcement.
"In these first six months, we’re seeing that this is a high return-on-investment for safety on our streets," Transportation Department Director Josh Rowan told the San Francisco Chronicle.
The data shows the program had an especially pronounced effect on the highest-speed offenders. In the first month that citations were issued, cameras averaged about 3,800 violations per day. Ticketed drivers were, on average, traveling 14 mph over the posted speed limit. By the most recent reporting month — from June 15 to July 15 — daily recorded violations had fallen to roughly 2,800 per day.
Where the changes were largest
Officials pointed to declines in the share of vehicles exceeding the limit by at least 11 mph. Across more than a dozen monitored locations, that category of speeding dropped by roughly 70%. The largest single-location improvement occurred on 7th Street between Adeline and Linden Streets: a 2024 evaluation showed 14% of vehicles were traveling 11 mph or more over the limit before cameras; after cameras were installed that figure fell to 1%.
- 35 cameras installed across 18 intersections.
- 526,324 total violations recorded during the pilot period.
- 193,508 citations and 332,816 warnings issued.
- High-speed (≥11 mph over) incidents decreased about 70% at many locations.
Data at a glance
| Measure | Value |
|---|---|
| Cameras installed | 35 |
| Intersections covered | 18 |
| Total violations | 526,324 |
| Citations | 193,508 |
| Warnings | 332,816 |
The city placed cameras specifically on the High-Injury Network (HIN), a targeted strategy intended to concentrate enforcement where severe and fatal crashes are most likely. According to the report, HIN streets make up about 6% of Oakland’s roadway miles but account for approximately 60% of the city’s severe and fatal collisions.
City transportation leaders framed the pilot’s early results as evidence the automated enforcement is working to change behavior on high-risk streets. The report’s figures indicate fewer extreme-speed infractions and a drop in daily violations since the program began issuing citations, outcomes city officials interpret as gains for street safety.
As the pilot continues, questions remain for policymakers, advocates and residents about long-term effects, equitable enforcement and how revenue from citations will be used. The city’s initial report documents behavioral shifts in the months after cameras went live; further evaluations are expected to assess whether reductions persist, how crash rates respond over time and whether additional engineering or outreach should accompany automated enforcement to improve safety on Oakland streets.
For Oakland drivers and people who walk, bike or ride transit, the early data suggests the presence of speed cameras correlates with a measurable decrease in high-end speeding on corridors most likely to produce serious injuries.