Public expenditure on education across the European Union represented 4.7% of GDP in 2023, according to figures released by Eurostat. The bloc-wide measure, which covers state funding from pre-primary through to tertiary education, shows a slight decline from the high recorded in 2020.
Trend since the pandemic peak
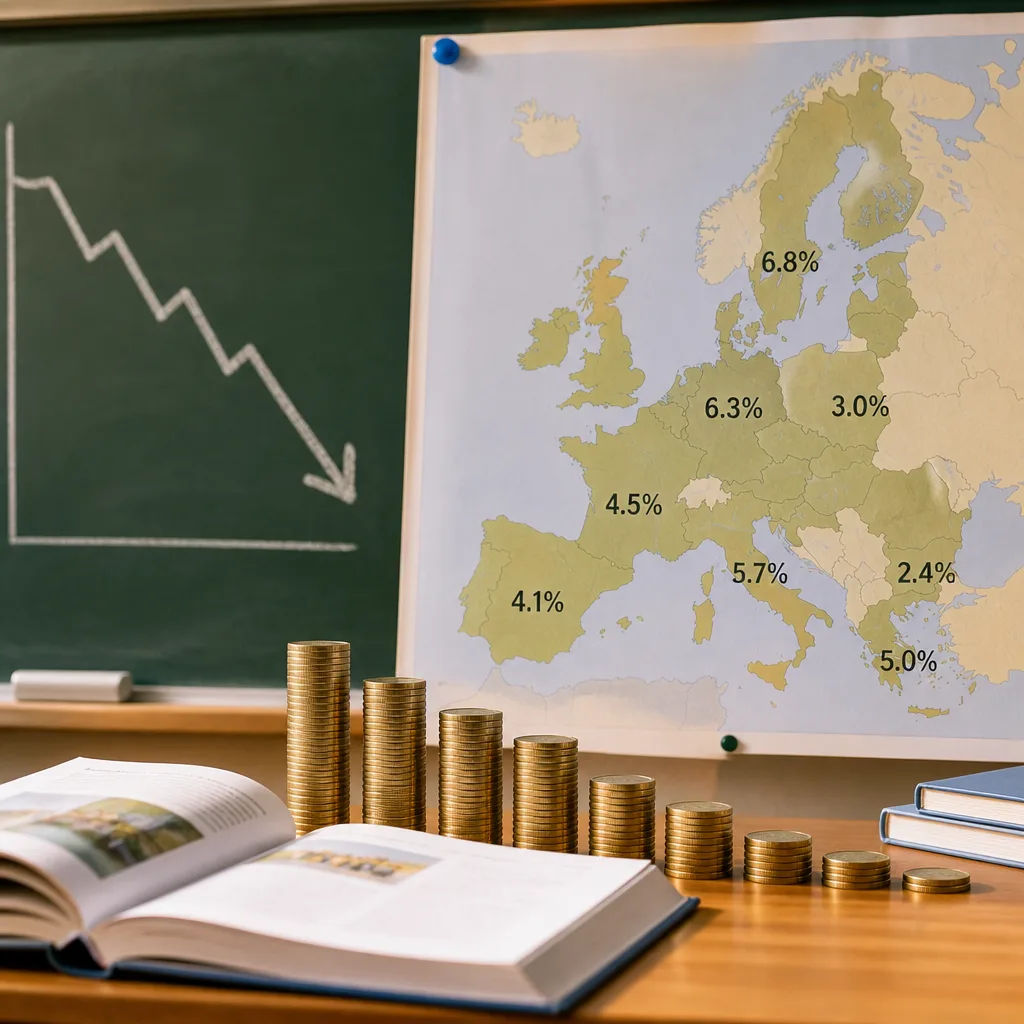
Eurostat’s dataset puts spending in 2020 at a peak of 5.0% of GDP, the highest level seen in the series that begins in 2012. By 2023, the share had reduced modestly, signalling that public investment in education has not returned to the relative intensity seen at the height of pandemic-era policy responses.
The data are expressed as a percentage of each country’s gross domestic product, a standard way to compare how much governments prioritise education relative to the size of their economies. The figures cover all levels of publicly funded education — from early years through higher education.
Wide differences between member states
Eurostat’s release highlights considerable variation across the union. At the top of the list, Sweden recorded the largest share of GDP directed to education at 6.8%, followed by Finland at 6.3% and Belgium at 6.2%. At the lower end, Romania reported the smallest proportion at 3.0%, while Greece and Malta spent 3.3% and 3.4% respectively.
| Country | Education spending (% of GDP, 2023) |
|---|---|
| Sweden | 6.8% |
| Finland | 6.3% |
| Belgium | 6.2% |
| Romania | 3.0% |
| Greece | 3.3% |
| Malta | 3.4% |
What the numbers mean for policy
Expressing education budgets as a share of GDP offers a way to gauge political prioritisation against economic output, but it does not show the absolute amounts spent, the distribution between levels of education, or real-terms changes in funding. A country with slower economic growth could see the share rise without increasing nominal education spending, while one with strong GDP growth could maintain or expand absolute allocations yet see the percentage fall.
Those caveats matter when interpreting the modest fall from 5.0% to 4.7% at EU level. Policymakers and analysts will want to disentangle movements driven by economic cycles from those that reflect deliberate changes in public spending choices. The Eurostat release is based on the union’s public finance dataset on education spending and therefore serves as a starting point for such scrutiny rather than a definitive assessment of adequacy.
Practical implications across the system
Variations between member states highlight differing national priorities and fiscal room for manoeuvre. Countries near the top of the scale tend to invest heavily in early years provision, teacher pay and tertiary funding, while lower-spending states may face constraints in expanding access or improving outcomes.
- Higher shares of GDP typically correlate with larger per-pupil investment and broader provision of services such as childcare and adult education.
- Lower shares can signal pressure on classroom resources, staffing levels and capital investment in school buildings.
- Trend analysis is necessary to understand whether changes reflect policy shifts, demographic developments, or macroeconomic effects.
Eurostat’s figures will be scrutinised by national education ministries, unions and international bodies as they assess recovery from the pandemic, the impact of inflation on budgets and long-term planning. For countries at either extreme of the distribution, the data will strengthen arguments both for protecting education allocations and for reforming how funds are targeted to improve outcomes.
The dataset, covering pre-primary to tertiary education, provides comparative evidence but leaves open many questions about how funds are spent within systems — an issue that will shape future debates about effectiveness and equity across the European Union.