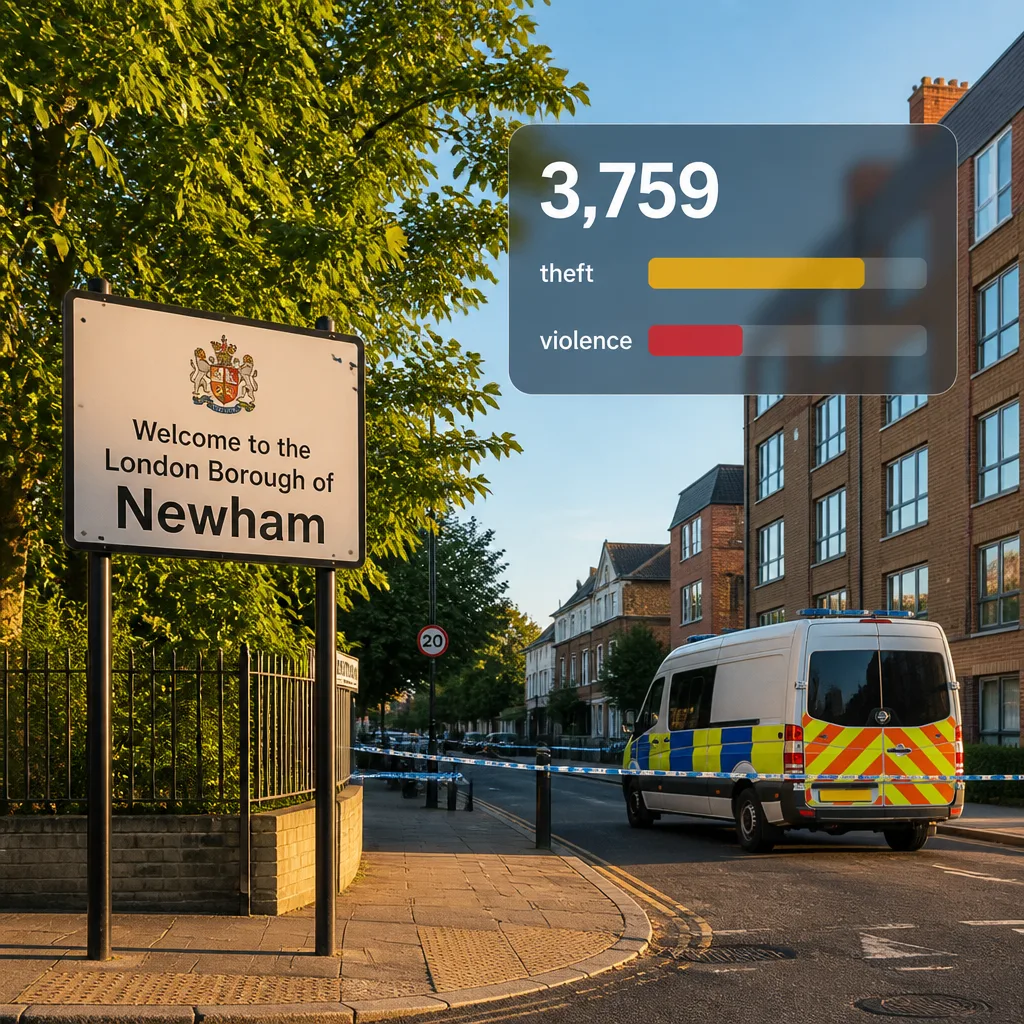
Metropolitan Police data released on the force's public dashboard shows Newham recorded the highest number of reported offences among east London boroughs in July, registering 3,759 reports.
Month-on-month changes and leading offence types
The July total for Newham represents an increase from the previous month, with the borough recording 3,555 reports in June — a rise of around 5.7%. The most frequently reported crime categories in Newham for July were theft (1,165), violence against the person (1,087) and vehicle offences (451), with public order offences, criminal damage and drug-related reports also contributing to the total.
Tower Hamlets had the second-highest count, with 3,599 reports in July, up from 3,465 in June, an increase of roughly 3.9%. The two largest contributors there were theft (1,183) and violence against the person (1,074), followed by public order incidents.
Redbridge followed with 2,210 recorded offences in July, a small rise from the June figure of 2,160. In several boroughs violence against the person and theft were prominent categories.
Where totals fell or remained steady
Waltham Forest was the sole borough among the six to report a marginal fall in recorded offences between June and July, with 2,047 reports in July compared with 2,098 in June. In that borough violence against the person accounted for the largest single category (648), followed by theft (558) and vehicle offences (231).
Havering and Barking and Dagenham reported broadly similar totals in June and July; Havering recorded 1,913 offences in July — a month-on-month rise of just under 4%.
Half-year perspective
The data set also shows that across the first six months of 2026 Newham remained the borough with the highest cumulative number of recorded offences, with a total of 20,924 incidents.
- Newham: 3,759 (July); 20,924 (first six months of 2026)
- Tower Hamlets: 3,599 (July)
- Redbridge: 2,210 (July)
| Borough | July reports | June reports |
|---|---|---|
| Newham | 3,759 | 3,555 |
| Tower Hamlets | 3,599 | 3,465 |
| Redbridge | 2,210 | 2,160 |
| Waltham Forest | 2,047 | 2,098 |
| Havering | 1,913 | (comparable to June) |
Context and implications
These borough-level figures reflect reports made to the Metropolitan Police and do not, on their own, indicate changes in victimisation rates or in policing activity. Recorded crime totals can be influenced by variations in reporting behaviour, changes in police recording practice and targeted operations that increase detection and recording of particular offences.
In Newham and Tower Hamlets, the prominence of theft and violence against the person mirrors broader patterns seen across London where those categories frequently account for a substantial portion of recorded crime. Vehicle offences also remain a significant element in some boroughs.
Local authorities and police forces use such monthly breakdowns to direct resources and prioritise interventions. The Met's publicly accessible dashboard enables councillors, community groups and journalists to track short-term variations and longer-term trends across neighbourhoods.
Further analysis would be required to determine whether the month-on-month rises signal sustained trends or reflect short-term fluctuations. The recorded figures form part of a complex picture that includes unreported offences, outcomes of investigations and the impact of crime-prevention measures.
Data referenced in this report were drawn from the Metropolitan Police's public tableau of recorded offences for east London boroughs for July 2026.