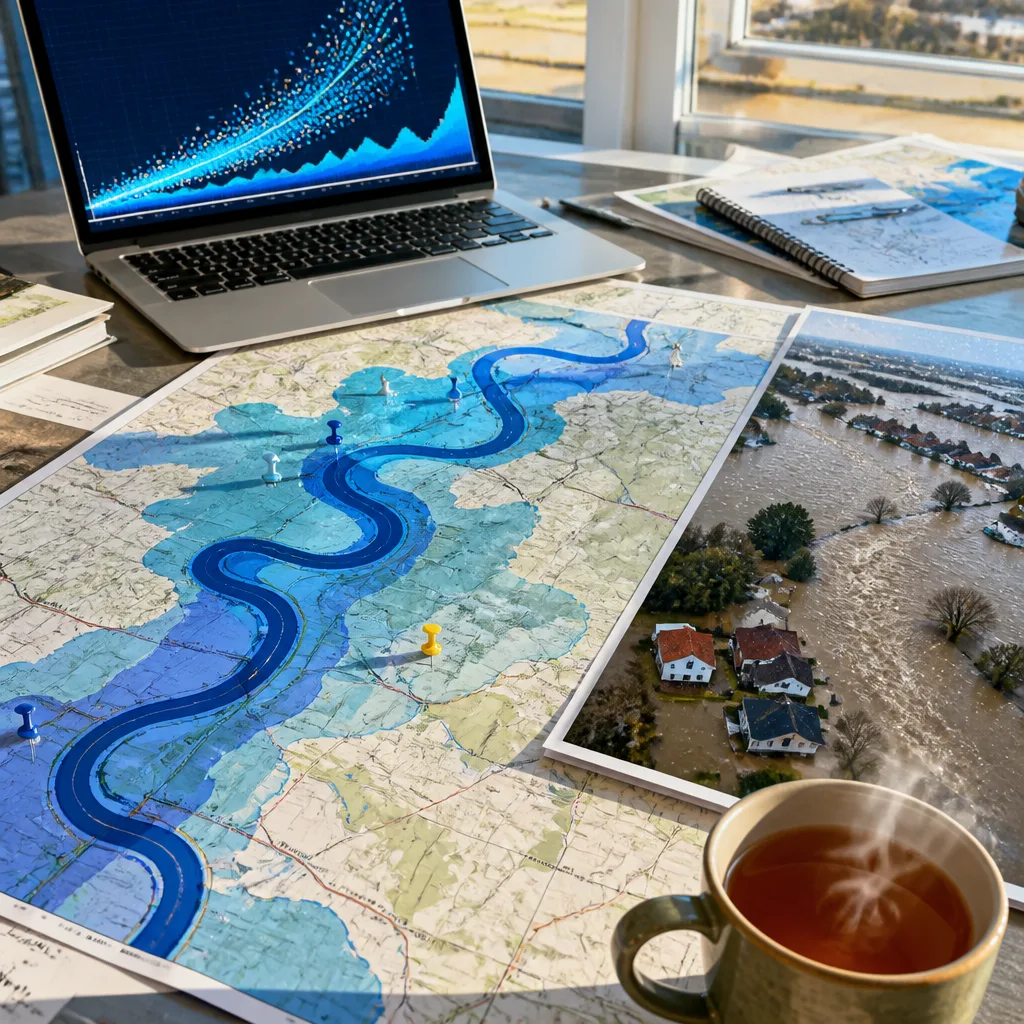
Flood maps used to guide planning, emergency response and insurance around the globe may be built on a shaky assumption about when rivers spill onto their floodplains, new research suggests. A team from Loughborough University and the University of Oxford assembled thousands of observations and used machine learning to test a decades‑old rule of thumb that remains embedded in many global models.
What the study examined
Flood modelling requires an estimate of the flow a river channel can carry before it overruns its banks — commonly called bankfull discharge or channel capacity. Where detailed river surveys and long flow records are available, that threshold can be measured directly. But such records exist only for a small fraction of the world’s rivers, and are concentrated in well‑monitored regions such as Europe and North America.
To fill that gap, many global flood datasets have long assumed that channel capacity corresponds roughly to a flow that occurs about once every two years. That practice traces back to a 1957 US Geological Survey observation that many rivers reach bankfull conditions at intervals of around one to three years. Nearly seven decades later, the new research set out to test how well that simplification holds across very different climates and river regimes.
Data and methods
The authors compiled 2,657 independent observations of bankfull discharge from multiple sources and combined them with data on climate, river flows, catchment characteristics and channel geometry. Using machine learning, they produced estimates of bankfull discharge along about 2.87 million kilometres of river network, covering channels wider than roughly 30 metres.
| Key figure | Value |
|---|---|
| Average annual global flood losses (USD) | 388 billion |
| People exposed to a 1‑in‑100‑year flood | 1.81 billion |
| Homes and businesses in England at risk | 6.3 million |
| Bankfull observations assembled | 2,657 |
| River length modelled | ~2.87 million km |
Implications for flood maps and decision‑making
If a model overestimates the flow a channel can contain, it will keep too much water inside the simulated bank, with the effect that both the area flooded and the depth of inundation are understated. That matters because flood maps inform a wide range of decisions — from where to site critical infrastructure and how to price flood insurance, to the design of defences and emergency planning.
The study highlights two interlinked challenges:
- Empirical data on channel capacity are sparse and geographically uneven, leaving many regions dependent on assumptions developed in very different environments.
- Applying a uniform statistical interval — such as the once‑in‑two‑years rule — across millions of kilometres of river risks systematic bias in flood exposure estimates.
Those problems are particularly important in countries where mapped flood extents are used to determine planning permission, insurance risk ratings and long‑term adaptation investment. In England, for example, the research underlines the exposure of around 6.3 million homes and businesses to flood risk and the potential for under‑ or mis‑classification of that risk if channel capacity is misestimated.
What this means for policy and practice
The authors do not propose a single quick fix. Instead, the research points to practical pathways that could improve model realism and reduce uncertainty in flood mapping:
- Expand observational networks where feasible, prioritising poorly sampled regions and larger channels that drive downstream flooding.
- Use statistical and machine‑learning approaches to map channel capacity where direct measurements are absent, while quantifying uncertainty explicitly.
- Revisit established assumptions in global models and assess how sensitive flood exposure estimates are to those choices.
For policymakers and insurers, the study is a reminder that flood maps are tools shaped by data availability and modelling choices. Improving those inputs will strengthen the evidence base for planning and for the difficult trade‑offs involved in adapting to a changing climate.
The research was published in Nature Communications and combines expertise from Loughborough University and the University of Oxford.