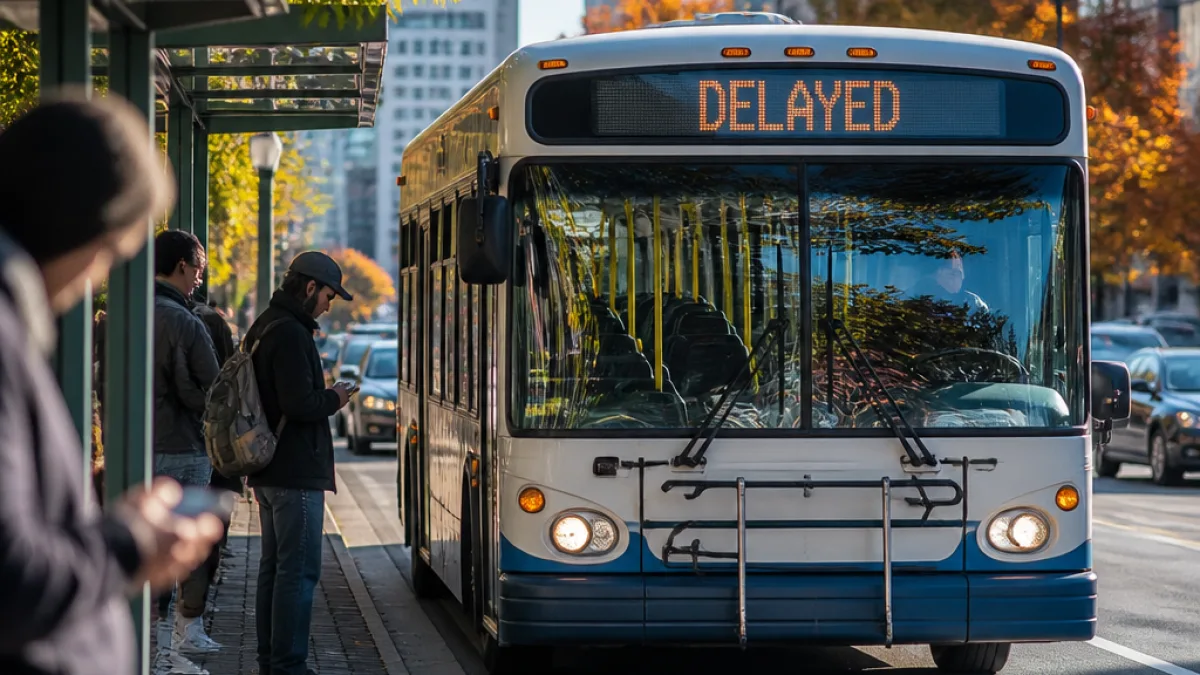
Transport networks in major cities are showing signs of stress as buses slow, journeys fall and reliability weakens — a trend that has sharp implications for municipalities across Canada, including London, Ont. Recent analysis of Transport for London (TfL) data shows passenger journeys in London have dropped by more than 300 million a year — a decline of roughly 16% since 2013 — even as the city’s population grew by almost a million people.
What the data shows
The Guardian’s visualised analysis, based on TfL figures, points to several worrying indicators: average bus speeds across London fell to 9.18 mph in 2025–26, the lowest since comparable records began in 2013–14, representing a 4.8% decline over that period. The report also shows a longer-term slowdown from roughly 9.6 mph in 2013 to about 9.2 mph in 2025, with a brief spike to 10.1 mph in 2020 during the pandemic.
Slower buses mean longer scheduled journey times and a higher likelihood of delays. The report cites research used by TfL that suggests a 10-per-cent fall in bus speed can lead to a 6-per-cent drop in demand — and when passengers leave the system, service frequencies and routes can be cut, reinforcing a downward spiral.
- Passengers: Down more than 300 million journeys annually since 2013 (about a 16% fall).
- Speeds: Average speed at 9.18 mph in 2025–26, lowest since 2013–14.
- Consequences: Reduced reliability risks further patronage loss and service reductions.
Voices from the capital
“We’re really concerned about bus usage. One of the reasons, when you speak to commuters, is a lack of reliability. And why is it they lack reliability? Because of bus speed.”
The quote, from London’s mayor Sadiq Khan, frames the urgency in plain terms: congestion that limits bus speed undermines public confidence, and that erosion of trust can be difficult and costly to reverse.
Why this matters for London, Ontario
While these data come from the UK capital, the dynamics are familiar to mid-sized Canadian cities. London, Ont., with its mix of inner-city corridors and sprawling suburbs, faces similar trade-offs between road space, vehicle traffic and transit reliability. Municipal leaders here wrestle with choices over bus priority measures, dedicated lanes, signal priority and how to balance street space among cars, buses, cyclists and pedestrians.
Slower bus speeds do more than lengthen commutes. They hit operating budgets — longer cycle times require more vehicles and drivers to maintain frequencies — and they undermine policy goals such as reducing car dependency and greenhouse-gas emissions. Service cuts that follow ridership loss can leave lower-income neighbourhoods with poorer access to jobs and services, widening equity gaps.
| Year (select) | Average bus speed (mph) |
|---|---|
| 2013 | ~9.6 |
| 2020 | 10.1 (spike) |
| 2025–26 | 9.18 (lowest recorded) |
Those numbers underline the message: small changes in average speed can cascade into large changes in passenger behaviour. For local transit agencies in Ontario, preserving and improving bus speed is a cost-effective means of protecting ridership.
Options and trade-offs
Municipalities considering responses have a suite of policy tools. These range from low-cost operational fixes — refining timetables, targeted enforcement of bus lanes and traffic-signal priority — to more ambitious street redesigns that reallocate road space. Each comes with political and practical trade-offs: giving buses more priority can constrain car traffic and parking, prompting pushback from drivers and businesses.
What London, Ont., and other Canadian cities can take from TfL’s experience is a stark reminder: once speed and reliability slip, reversing the trend is difficult and expensive. Preventing a “vicious circle of decline” means acting early to protect bus performance, monitoring outcomes and communicating clearly with riders about changes and expected benefits.
As cities grow and demand on streets intensifies, the question for local councils is not whether to act, but how quickly and decisively to prioritise the modes that serve the most people. The cost of delay may be measured not just in minutes but in riders lost and services diminished.