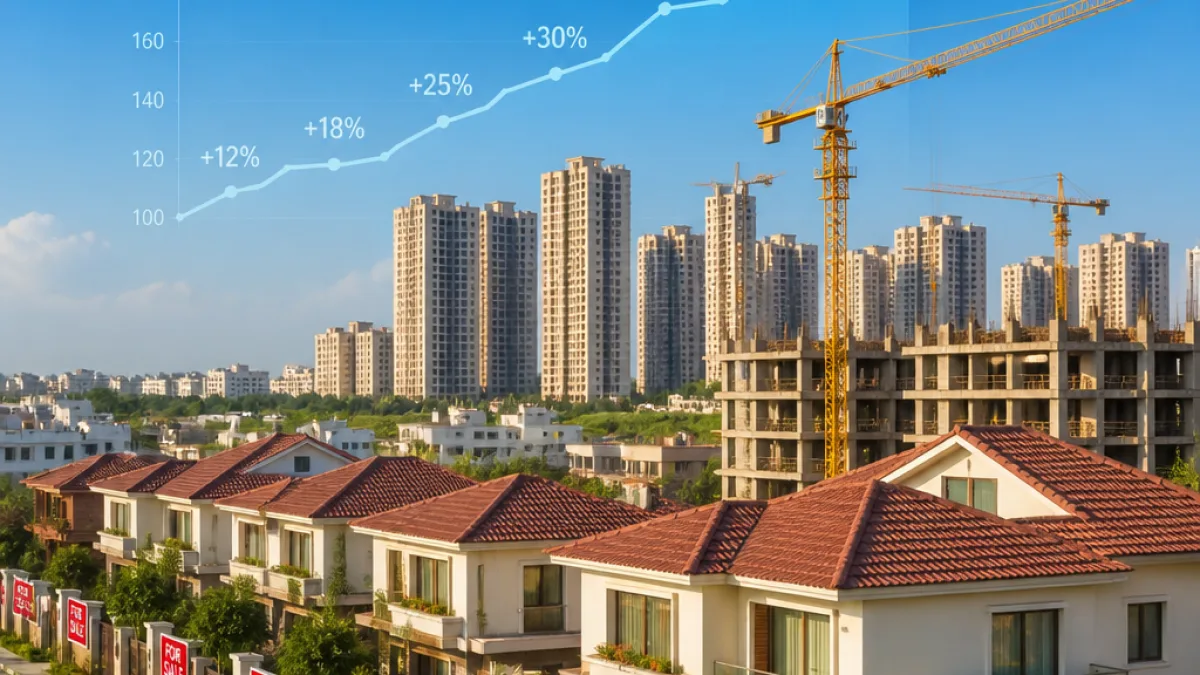
The Reserve Bank of India (RBI) on Monday said the All‑India House Price Index (HPI) rose to 117.5 in the first quarter of 2026‑27, recording a 1.1 per cent increase over the previous quarter and an annual growth of 3.6 per cent. The central bank identified cities including Lucknow among those that contributed to the year‑on‑year gain, even as the pace of price appreciation moderated from the 4.5 per cent recorded in Q4 FY26.
RBI figures and city coverage
The HPI is compiled quarterly by the RBI using transaction‑level data received from property registration authorities and uses 2022‑23 as its base year. The index covers 18 major cities across the country. According to the RBI, the latest quarter’s rise was primarily driven by increases in the indices for cities such as Chandigarh, Lucknow and Thiruvananthapuram.
"The HPI registered an annual growth of 3.6 per cent in Q1:2026‑27, same as in Q1 of the previous year, mainly contributed by the cities such as Chandigarh, Jaipur, Kanpur, Lucknow and Thiruvananthapuram," the RBI said.
The RBI’s city list for the HPI comprises: Mumbai, Delhi, Chennai, Kolkata, Bengaluru, Lucknow, Ahmedabad, Jaipur, Kanpur, Kochi, Hyderabad, Thiruvananthapuram, Pune, Ghaziabad, Thane, Gautam Buddha Nagar, Chandigarh and Nagpur. The index is intended to indicate movements in residential property prices based on registered housing transactions in these urban centres.
What the numbers mean for Lucknow
For Lucknow residents, the RBI’s identification of the city among those contributing to the annual HPI gain signals sustained demand or upward pressure in registered transaction values in the quarter. A moderation in the national growth rate to 3.6 per cent, while still positive, suggests a slowing momentum compared with the immediately preceding quarter.
- Index level: All‑India HPI at 117.5 in Q1 FY27 (base 2022‑23).
- Quarterly change: +1.1% vs Q4 FY26.
- Yearly change: +3.6% YoY; unchanged from Q1 FY26 but lower than Q4 FY26 (4.5%).
The HPI data are derived from actual registration records and therefore reflect transactions that have been legally recorded. For buyers, sellers and developers in Lucknow, this means the RBI’s figures offer a corroborated view of price movements rather than survey‑based sentiment indices. Lenders and investors also monitor the HPI for underwriting, portfolio planning and market analysis.
Context and consequences
While the national index deceleration may ease some concerns about rapid inflation in housing costs, the RBI’s note that specific cities—Lucknow among them—contributed to the annual rise underscores the uneven nature of the market. Local supply‑demand dynamics, infrastructure projects, new launches and land‑registration activity can push city‑level indices independently of national trends.
For municipal planners and policy‑makers in Lucknow, monitoring registration trends and price movements matters for revenue projections linked to stamp duty and registration fees, as well as for housing affordability assessments. Real‑estate stakeholders may interpret the RBI data as a signal to calibrate pricing, marketing and launch schedules for new projects.
Investors and prospective homebuyers should consider the RBI HPI as one of several indicators. Price movement in registered transactions may lag short‑term market sentiment, and local enquiries with registrars, banks and brokers remain essential to gauge micro‑market conditions across Lucknow’s residential pockets.
| Measure | Q1 FY27 |
|---|---|
| All‑India HPI | 117.5 |
| Quarter‑on‑quarter change | +1.1% |
| Year‑on‑year change | +3.6% |
The RBI’s HPI release provides a verified snapshot of residential price trends across the cities covered. For Lucknow, being named among contributors to the annual rise highlights the city’s ongoing role in regional housing market dynamics as the state capital and a growing urban economy in Uttar Pradesh.